RAMBLER FEATURE: The Air We Breathe Is Being Monitored in Franconia Park
The Air Quality Index (AQI) has long been an occasional component of the daily weather forecast, particularly when it's high, cautioning the young, old, and health-impaired to limit their time outside. However, air quality took center stage in June as residual smoke from wildfires in the Canadian provinces of Ontario and Quebec drifted south and blanketed the DC region with hazy, harmful air.

AQI is the Environmental Protection Agency's index for air safety. It ranges from zero to 500 and is organized into five increasingly harmful categories: green (0-50), yellow (51-100), orange (101-150), red (151-200), purple (201-300), and maroon (301-500).
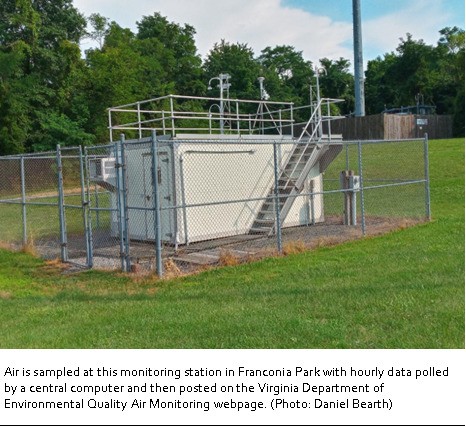
On June 8, the DC metro area posted a record high AQI of 198, according to a report in the Washington Post. But did you know that one of the places where the air is sampled is literally in our back yard? Yes, the monitoring station is in Franconia Park, just beyond the Rec Center, next to a cell phone tower and close by a baseball field.
Dan Salkovitz, a meteorologist with the Virginia Department of Environmental Quality, said Franconia Park was carefully chosen due to the relative absence of nearby pollution sources, like highways or industrial centers, accessibility to technicians, and a variety of other EPA criteria. It measures six distinct pollutants, all of which can contribute to AQI: sulfur dioxide, ozone, carbon monoxide, nitrogen dioxide, particulate matter (PM10 and PM2.5).
The latter two pollutants refer to inhalable particles that are 10 and 2.5 micrometers or smaller respectively. While ozone and PM10 can be proxy measures for smoke like that which blanketed the area in June, PM2.5 was the primary driver of poor air quality that exceeded the safe levels established by the National Ambient Air Quality Standards (NAAQS).
Contrary to the Washington Post report, Salkovitz said that AQI levels from early June (rated at the high end of the “code red” level) were not the highest ever experienced. In 2012, the station recorded a "code purple" day, although the main pollutant on that day was ozone.
Far more important than these daily spikes, however, is the broader trend line for AQI in the region. The good news is that air quality has been trending in a positive direction for many years.
"It is important to realize that air quality throughout Virginia has been greatly improving in recent decades," Salkovitz told the Rambler via email. "For example, the number of days when ozone exceeds the NAAQS has dropped from dozens of days per year (approximately six dozen days in 1991 and 2002 alone) to just a few days per year now."
Air quality data from Franconia Park and four other monitoring stations in Northern Virginia are used to calculate the AQI for the Washington, D.C. area and can be found online at www.deq.virginia.gov/our-programs/air/monitoring-assessments/air-quality-forecast.
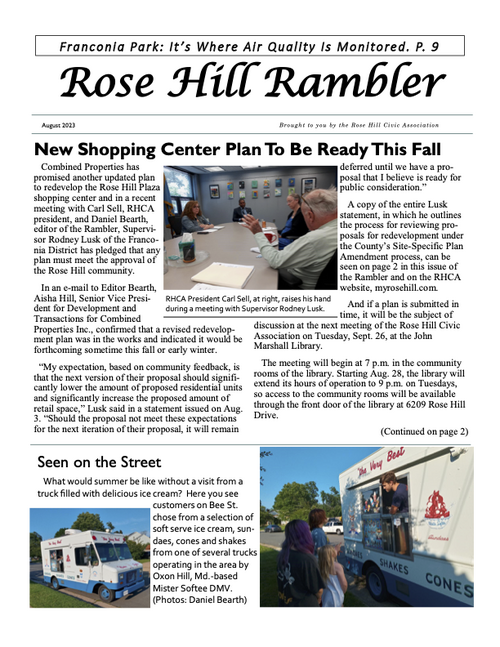
Check out the rest of the August 2023 Rambler!
Recent
Rose Hill Civic Association Meeting on Tuesday, January 27 Cancelled
January 26th, 2026
Steven Able: What It Means To Be a Coach
November 26th, 2025
Chain of Small Miracles: How CPR, Community and Perfect Timing Saved my Dad
November 20th, 2025
How We Fixed a Shifting Foundation at our Home on Carriage Dr.
May 29th, 2025
Letter to Supervisor Lusk on Highland Drive Redevelopment
March 25th, 2025
Archive
2025
2024
May
2023
August
October
November
Categories
no categories
